Bokena Series Pt 2 Blog 4 : APA SIA FRACTIONAL AND FULL FACTORIAL
Hello everyone, and welcome back to another bokena series. TODAY we are gonna talk about Design of experiments also know as DOE.
APA DOE sia?? DOE is just the statistics - based approach to designing experiments. It is a methodology that allows us to obtain knowledge of complex, multi-variable processes with the least number of trial possible. This means that the tedious method of trying out different combinations of trials will be reduced and optimised and it actually the backbone of any product design and the comparison of any improvement efforts made.
To make it more easier to understand, let me explain to you by using popcorn as an example. Hypothetically, you have a bag of kernels that weight a 100g and you would like to know an accurate prediction of how many kernels actually pop into popcorn. Before starting the calculations, we all know that it is impossible to ensure that all the kernels are fully popped meaning that the yield cannot be 100%. And to add on, the yield that we get is based on many different factors. So what are these factors that we are gonna compare
- Diameter of the bowl containing the kernel (10cm & 15cm) - Factor A
- Duration that the kernels are microwaved (4 mins & 6 mins) - Factor B
- Power setting of the mircowave ( 75% & 100%) - Factor C
So we are going to conduct 8 runs using the lower values and higher values ensuring that all the different variation are tested out. This process of testing out all the different variations is called the full factorial method.

Full factorial method
Based on the values we got from each of the different variations, we can see which combination of lows and highs will provide us with the best outcome possible and the averages.

To summarise the table, for factor A, when you increase the bowl diameter from 10 to 15 cm, the average mass decreases from 1.495g to 1.3475g.
For factor B, when you increase the microwave time from 4 mins to 6 mins the average mass reduces from 1.9675g to 0.875g.
Lastly for factor C, when you increase the power setting from 75% to 100% the average mass decreases from 2.325g to 0.5175g.
Once collating the averages, we can then produce the graphs which display the effects and significants of each factor that we had compared.

As you can see from the graph factor C has the steepest drop when using the high value and the low values showing us that it is the most significant factor amongst the 3. Another simple way to identify the significance of each factor is by comparing their gradients, the factor with the largest gradient would be the most significant factor. We can also see that factor B has a similar gradient to C but not as steep making it the second most significant factor. Following with factor A, with the least gradient, the least signifiant factor.
Interaction Factor
Now we will be comparing how each factor interacts with another factor and we will be collating the averages.
For factor A & B interaction

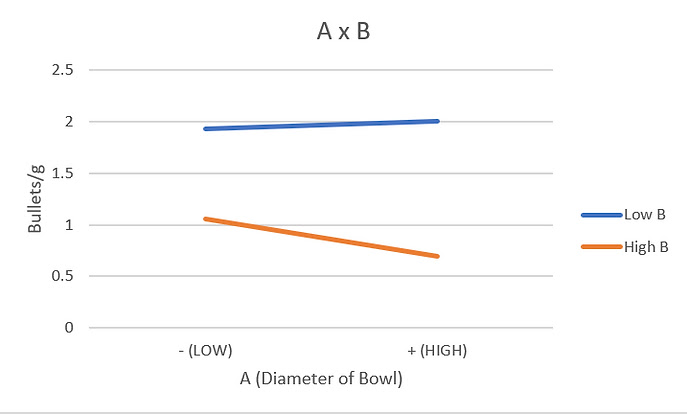
As you can see from the graph, you can see that both the gradient lines are different. One is increasing while the other is decreasing. When using the low value of B and interacting with the low comapred high value of A you can see that the graph rises. However, when using a high value of B and interacting with the low compared high value of A the graph drops. Showing that there is a strong interaction between the 2 factors.
Next we shall compare B & C to see how the 2 factors interact with each other.
For factor B & C interaction


For factor B & C, their interaction is fairly similar as both the gradient lines drop. However, the difference in the lines as when the low value of B interacts with the the low and high value of A the graph tends to be more steeper meaning that the mass reduction from low value of A to the high value causes more kernels to pop. However, despite looking famliar, the when the high value of B interacts with the high and low values with a the mass reduction is slightly lower as the gradient is less steep.
Lastly we shall compare A & C to see how the 2 factors interact with each other.
For factor A & C interaction


For the interaction of A and C, we can see that it is similar to the first interaction of A and B. Where the graph with the interaction of the high value of C with the low compared high value of A increase while the interaction of the low value of C with the low compared to the high value of A decreases.
After looking at all the different factors, we can actually conclude that B and C have the most significance while A has the least. However, when we compare the interactions we can actually see that despite seeming to be insignificant A still has effects when comparing with the other factors making it important as well.
Fractional factorial method
For fraction factorial method, what we do is we only do the runs which seems more important and contain the information that we require. Sometimes when doing the runs, there will be a few runs that are not required. Especially when there are multiple hundred runs to complete it would be more effective and less time consuming when specifically selected runs are compared.

For the interaction of A and C, we can see that it is similar to the first interaction of A and B. Where the graph with the interaction of the high value of C with the low compared high value of A increase while the interaction of the low value of C with the low compared to the high value of A decreases.
After looking at all the different factors, we can actually conclude that B and C have the most significance while A has the least. However, when we compare the interactions we can actually see that despite seeming to be insignificant A still has effects when comparing with the other factors making it important as well.
Fractional factorial method
So for our fractional factorial method, I have decided to use runs 1,2,3 & 6.

.webp)
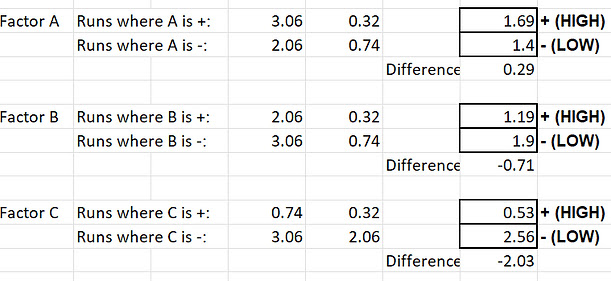
While using fractional factorial method, as you can see from the tables and graphs, for factor A, when the diameter decrease from 15cm to 10 cm, the mass increased from 1.69g to 1.4g
For factor B, when the microwave time increases from 4 mins to 6 mins you can see that the mass decreases from 1.9g to 1.19g
For factor C, when the microwave power increases from 75% to 100 % you can see that the mass decreases from 2.56g to 0.53g
Conclusion
This shows that C, microwave power, is the most significant factor and this is the same throughout full and fractional factorial method. Despite using lesser runs to compare, we can notice that the final outcome remains the same while using lesser effort and time.
However, when using full factorial method you can notice that the graph for A actually drops while the graph for A is the fractional factorial method rises. This means that due to not fully comparing all the runs there could still be a little inaccuracy in the final results.
Reflection on the topic
DOE seemed very inefficient to me as we had to choose many from the man different runs and as someone who is very matriculate I find it a little disturbing when I do not compare all the values being provided. There may always be information missed out when not accounting for the extra runs. However, when looking at a large scale I had noticed that it is very difficult to actually conduct many different runs and may cause the conductors to lose interest or morale making the values collect to be sometimes inaccurate.
This was well observed in our practical session, we were to conduct 64 different runs making it very painstakingly long to completely and many of my groupmates just wanted to complete the runs as fast as possible. This would lead to us sometimes estimating the values instead of finding accurate ones.
However, this tardiness was actually something that had caused us our marks as the final test would to use the values that we had found to use the values that we had taken to hit certain targets, namely the teachers faces.
This shows the true value of fractional factorial method as it is short and sweet while maintaining a certain level of accuracy. Out of the 64 runs for the fractional factorial we only had to use 16. That is 4 times lesser and would have allowed us to finish faster as well.
All in all, the practical was a fun oppertunity for us to enjoy the lesson and to put in what we had learnt to use.
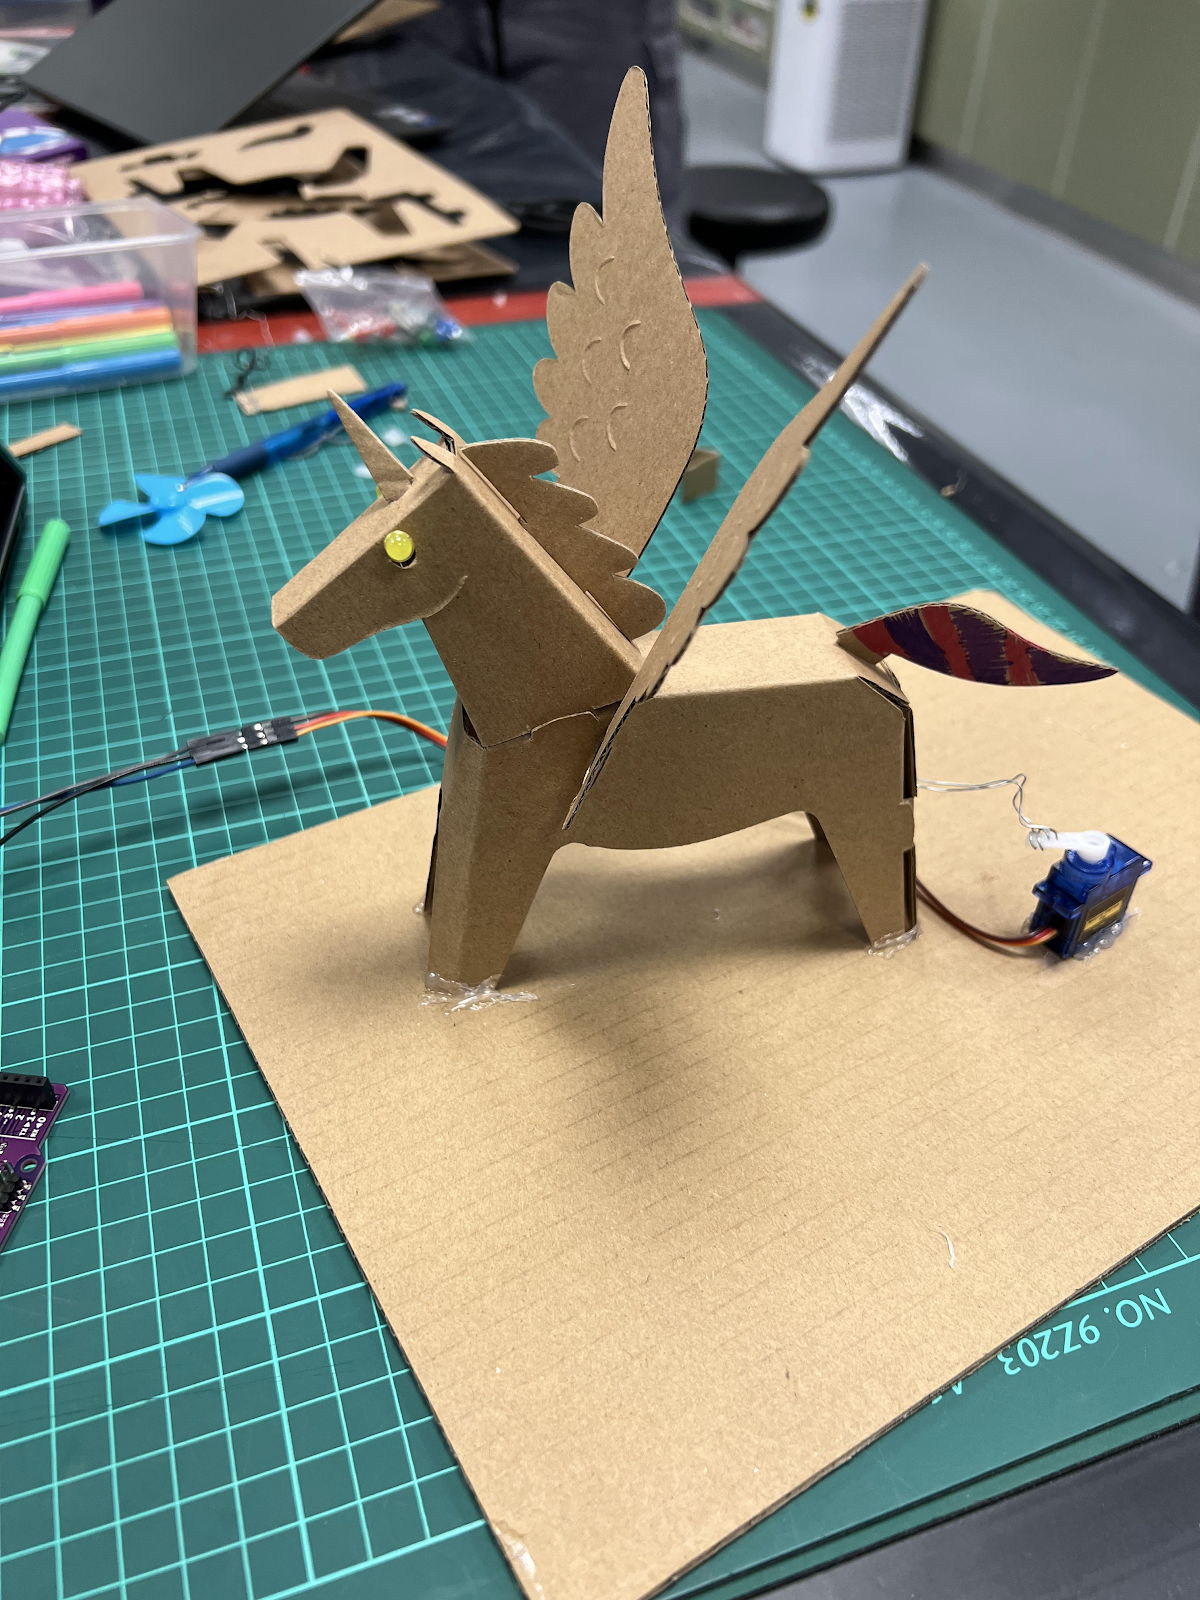
That said I have a few pics and vids for y'all to watch of our practical.

.jpeg)
.jpeg)
This is the face of a true chemical engineer.
.jpeg)
I thank y'all for reading my blog and stay tune for the next one. AND once again I AM DR BOKENA THE GREATEST.


Comments
Post a Comment